ARTICLES / IDEAS & INSIGHTS

Good questions. Better perspectives.

Explore visual analytics, product thinking, and the engineering that turns complex data into something useful.

254 articles

News and Press

Different Sources, Shared View

A single map shows one view of the world. Bringing different datasets together can reveal a much richer picture. Geographic analysis becomes more useful when information from different sources can be explored in the same…

Read article


News and Press

Data At Scale, Endless Discovery

Powerful data applications need more than a way to display data. They need analytics that can work at scale. For software teams building data-rich products, the challenge is to give users meaningful ways to explore…

Read article
News and Press

Embedded Analytics, Seamless UX

Building dashboards is becoming easier than ever. But delivering a powerful analytical experience inside a software product is a different challenge entirely. For SaaS platforms and data applications, analytics shouldn't…

Read article
News and Press

From Data to Insight

“The purpose of computing is insight, not numbers.”- Richard Hamming Data analysis is ultimately about more than producing numbers. The real value comes from what those numbers help us understand: patterns,…

Read article
News and Press

Layer Data, Reveal Context

Geographic insight becomes infinitely more powerful when different datasets can be viewed together. ChartFactor's Interactive Multi-Layer Geo Maps allow users to combine geographic information from multiple data sources…

Read article
News and Press

Intelligent Analysis, Any Scale

AI-powered analytics doesn't have to mean putting your entire dataset into an AI model. ChartFactor Studio Assistant takes a different approach. Rather than requiring all of the underlying data to fit within an AI…

Read article
News and Press

Ask Questions, Uncover Insights

What if exploring your data could start with a question instead of a dashboard? ChartFactor Studio Assistant brings natural-language interaction into the analytical process, helping users explore data by asking questions…

Read article
News and Press

Analytics on Your Terms

“Information is the oil of the 21st century, and analytics is the combustion engine.”- Peter Sondergaard The value of data isn't determined only by how much of it an organisation has. It also depends on how easily - and…

Read article
News and Press

Reshape Data, Discover Patterns

Large datasets shouldn't mean rigid analysis. ChartFactor Studio's Pivot Table V2 is designed to give users more freedom to explore massive datasets, currently with support for Google BigQuery. Rather than locking users…

Read article
News and Press

Layered Data, Deeper Context

One layer gives you a view. Multiple layers give you context. ChartFactor’s Interactive Multi-Layer Geo Maps allow teams to bring geographic information together from different data sources and data engines within the…

Read article
News and Press

Geographic Trends, Visual Insights

Data becomes much more interesting when you can see how it changes. ChartFactor’s NCHS Drug Poisoning Mortality by County application turns a large public health dataset into an interactive way to explore mortality rates…

Read article
News and Press

Seeing the Same Data, Discovering Something New

“Discovery consists of seeing what everybody has seen and thinking what nobody has thought.”- Albert Szent-Györgyi Analytics has always been about discovery. The data itself may be available to everyone, but the insights…

Read article
News and Press

Multiple Sources, Single View

Modern data rarely lives in a single place. Organizations increasingly rely on multiple databases, engines, and services, which makes bringing information together one of the biggest challenges in analytics today.…

Read article
News and Press

Reshape Data, Find Insight

As data grows, the ability to explore it flexibly becomes just as important as the data itself. ChartFactor Studio's Pivot Table V2 is designed to support that kind of exploration. Built for massive datasets (currently…

Read article
News and Press

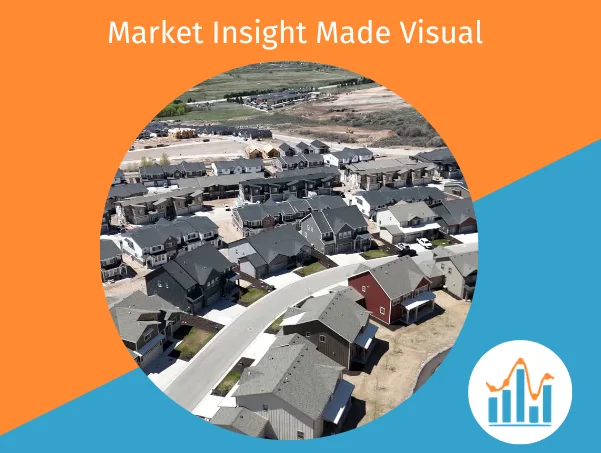
Market Insight Made Visual

Some of the most useful analytics applications are the ones that help people make sense of decisions they face every day. ChartFactor's Residential Real Estate application was built with exactly that in mind. Using…

Read article
News and Press

Seeing Data Differently

“We don't see things as they are, we see them as we are.” - Anaïs Nin One of the most valuable outcomes of analytics is the ability to challenge assumptions and see information from a different perspective. As…

Read article
News and Press

Navigate and Discover

Some of the most valuable analytics projects begin with data that already exists, the hard part is making that data accessible and useful. ChartFactor’s Airbnb analytics application demonstrates how interactive analytics…

Read article
News and Press

From Overview To Detail

Good analytics should help users move naturally from overview to detail without forcing them to change tools or workflows. That principle is one of the reasons interactive multi-layer geo maps are becoming increasingly…

Read article
News and Press

Reshape and Explore

As datasets grow larger, the challenge is no longer collecting information, it's making exploration feel effortless. ChartFactor Studio's Pivot Table V2 was built to support that goal. Designed for large-scale datasets,…

Read article
News and Press

Effortless Connection, Endless Insight

The usefulness of analytics often comes down to how quickly users can move from raw data to meaningful exploration without unnecessary setup or workflow friction slowing things down. ChartFactor Studio is designed to…

Read article
News and Press

Flexible Analytics, Local Control

The usefulness of analytics often comes down to how quickly users can move from raw data to meaningful exploration without unnecessary setup or workflow friction slowing things down. ChartFactor Studio is designed to…

Read article
News and Press

Uncover Patterns At Every Scale

Seeing where something happens often changes how you interpret what is happening - and what action to take next. ChartFactor Geo is built to make spatial analysis both intuitive and scalable. As users move between…

Read article
News and Press

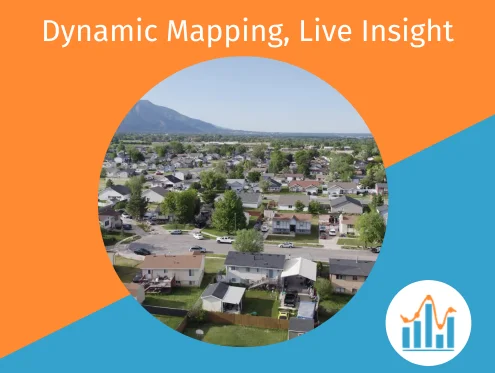
Dynamic Mapping, Live Insight

Sometimes the best way to understand a dataset is to explore it geographically and interact with it in real time rather than looking at static charts or reports. That’s one of the core ideas behind the ChartFactor’s…

Read article
News and Press

Flexible Data, Deeper Insight

As data products evolve, expectations move beyond simple dashboards toward deeper, more flexible analysis. ChartFactor supports this shift through capabilities designed for both scale and usability. Pivot Table V2 allows…

Read article
News and Press

HPTC - Complex Pricing, Seamless Flow

Data may be accessible in principle, yet still difficult to use meaningfully in real workflows. Hospital pricing data in the U.S. is a clear example. Machine Readable Files (MRFs) are large, fragmented, and challenging…

Read article
News and Press

Explore With Confidence

Speed in analytics isn’t just about performance - it’s about how quickly users can move from a question to a meaningful answer. ChartFactor Studio continues to refine that experience by making interaction more direct and…

Read article
News and Press

Spatial Insight, Clear Decisions

Geospatial analytics becomes truly powerful when performance remains consistent at every level of detail. ChartFactor Geo enables interactive spatial visualisations that stay responsive as users zoom, filter, and refine…

Read article
News and Press

Smooth Connection, Rapid Discovery

Strong analytics platforms remove friction long before insights are delivered. ChartFactor Studio continues to streamline how users connect to and explore their data, with optimized Text Search delivering faster and more…

Read article
News and Press

Fast Exploration, Clear Insight

When working with live data, even small improvements in interaction can significantly accelerate the path to insight. ChartFactor Studio’s latest Raw Data Table enhancements are designed to make exploration more direct…

Read article
News and Press

Spatial Precision At Every Scale

Geo analytics becomes truly valuable when interaction remains smooth - even as datasets expand dramatically. ChartFactor Geo supports interactive, client-side map visualisations that stay responsive as users zoom,…

Read article
News and Press

Faster Searches, Better Decisions

Data exploration often begins with a search - and the faster that search responds, the faster better decisions can follow. ChartFactor Studio’s Text Search component has been optimized to deliver quicker, more responsive…

Read article
News and Press

Scaling Without the Noise

“Good design is as little design as possible.” - Dieter Rams The best analytics systems don’t draw attention to themselves. They simply work; adapting as products grow, data scales, and user needs change. ChartFactor is…

Read article
News and Press

Modular Scalable Analytics

When analytics are bolted onto a product, they tend to age badly. Updates become risky, performance tuning turns painful and customisation can feel constrained. ChartFactor takes a different approach. Its modular…

Read article
News and Press

Spatial Clarity, Granular Detail

Geographic data only creates value when users can interact with it fluidly - without waiting for queries or wrestling with overloaded maps. ChartFactor’s geo capabilities are built to support just that kind of experience…

Read article
News and Press

Visual Analytics Without Friction

When teams build data products, the analytics layer can quietly become a drag on progress; introducing friction between design, engineering, and infrastructure instead of enabling momentum. ChartFactor Studio is designed…

Read article
News and Press

Building Analytics That Evolve With Your Product

“It’s not the strongest of the species that survives…but the one most responsive to change.” - Charles Darwin In data products, adaptability matters more than almost anything else. Datasets grow. User expectations shift.…

Read article
News and Press

User-Driven Evolution

Analytics should feel like a core part of your product, not a separate system which users have to tolerate. That’s why ChartFactor’s Toolkit is designed to help teams build analytics that feel native, responsive, and…

Read article
News and Press

Rich, Scalable Geo-Exploration

Location data only becomes valuable when it’s easy to explore and when performance holds up as scale grows. ChartFactor’s geo capabilities are designed around that reality; providing users with responsive maps, smooth…

Read article
News and Press

Frictionless Analytics

When analytics tools slow teams down, it’s rarely just because they lack features. More often, it’s friction in everyday workflows - setup confusion, awkward interactions, or small usability gaps that compound over time.…

Read article
News and Press

Designing Analytics for the Long Game

“The future depends on what we do in the present.” - Mahatma Gandhi In software, especially when it comes to data products, the decisions you make today determine how fast you can move tomorrow. Architecture, tooling,…

Read article
News and Press

Turn Complexity Into Momentum

For SaaS teams building data products, analytics can either accelerate your roadmap - or slow everything down. ChartFactor is built so that analytics becomes a catalyst rather than a constraint. You get modular…

Read article
News and Press

See Clearly, Act with Confidence

Some product decisions only become obvious when you understand where the data is actually happening. ChartFactor’s geo capabilities are built to make that spatial context fast, intuitive, and seamless to embed directly…

Read article
News and Press

Interactive Intelligence On Demand

When teams build data products, the analytics layer can often become a bottleneck - too many moving parts, too much overhead, and too much friction between design, engineering, and infrastructure. ChartFactor Studio…

Read article
News and Press

Visual Analytics You Control

For data-centric SaaS startups or product teams, visual analytics has become an essential requirement. But embedding dashboards, managing BI servers, and buying expensive analytics platforms can drain your finances and…

Read article
News and Press

Geo-Exploration At Every Scale

Location isn’t just a feature - it’s a dimension that unlocks deeper insight and delivers richer user experiences. With ChartFactor’s Geo tools, your SaaS product can offer layered, interactive maps that go far beyond…

Read article
News and Press

Embed Intelligence, Iterate Fast

Building your SaaS product is about so much more than just getting to market. It’s about building analytics that grow, evolve, and remain maintainable well beyond launch. ChartFactor Studio is designed precisely with…

Read article
News and Press

Building Analytics That Grow With Your Product

“Patience and foresight are the two most important qualities in business.” — Henry Ford Launching a SaaS product is only the start. What matters more in the long run is whether your analytics keep pace - with your users,…

Read article
News and Press

Enterprise Grade Visual Analytics

In early-stage SaaS and data products, every dollar and hour matters and performance expectations grow quickly. That’s why our ChartFactor visual analytics software has been specifically designed to deliver…

Read article
News and Press

Explore and Grow

Spatial data is powerful - but only when your maps are as flexible as your product demands. ChartFactor’s Geo Map elevates mapping beyond simple pins. You can layer markers, shapes, proportional circles, and heat maps;…

Read article
News and Press

Rich Analytics Lighting Fast

When building a SaaS product, one of the hardest challenges is giving your users rich analytics without turning your tech stack into a mess of different layers. ChartFactor Studio is designed to address this issue,…

Read article
News and Press

The System Behind Scalable SaaS Analytics

‘You do not rise to the level of your goals, you fall to the level of your systems.’ - James Clear When building a SaaS product, your analytics need to be as reliable and scalable as the product itself. Every chart,…

Read article
News and Press

Visual Analytics Built For The Future

Building a SaaS product often presents constant trade-offs between speed and precision. ChartFactor Studio helps make that tension easier to manage. Our browser-based analytics platform eliminates the need for…

Read article
News and Press

Connected Insights, Seamless Delivery

Some insights only reveal themselves when you see the ‘where’ behind the data. ChartFactor’s geo visualization tools go well beyond simple pinpoints. Our software enables layered, interactive maps that embed directly…

Read article
News and Press

Complexity Made Simple

For early-stage SaaS and data-product teams, visual analytics can sometimes be seen as a “nice-to-have.” Done right, however, visual analytics will quickly become part of your value proposition. ChartFactor fills that…

Read article
News and Press

BigQuery-Native Pivot for Massive SaaS Analytics

A powerful new version of the ChartFactor Pivot Table is here, currently supported for Google BigQuery. If you build visual analytics into a SaaS product, this will change how you deliver insights—fast, scalable, and…

Read article
News and Press

Shortening the Road to Product Value

“A good system shortens the road to the goal” - Orison Marden When building your SaaS product, every component needs to be reliable, flexible, and easy to maintain - especially your visual analytics. ChartFactor helps…

Read article
News and Press

Build Your Flow

Incorporating visual analytics into your product requires balancing rapid iteration with sustainable design. ChartFactor Studio Desktop provides a local-first environment that helps teams explore datasets, prototype…

Read article
News and Press

High Performance Visualization

You chose BigQuery for speed and scale. Why settle for anything less when it comes to your visual analytics? ChartFactor Studio offers a direct, high-performance integration with Google BigQuery - no data movement, no…

Read article
News and Press

ChartFactor Jira Connector Kit

Want to see how your team is spending their time without paying for extra plugins? If your team logs work in Jira and you use ChartFactor Community to explore and visualize your data, this free tool makes life a lot…

Read article
News and Press

Putting Your Data On the Map

ChartFactor’s geo visualization capabilities bring spatial data to life with high-performance, interactive maps that are fully customizable and designed to integrate natively into SaaS products and data platforms.…

Read article
News and Press

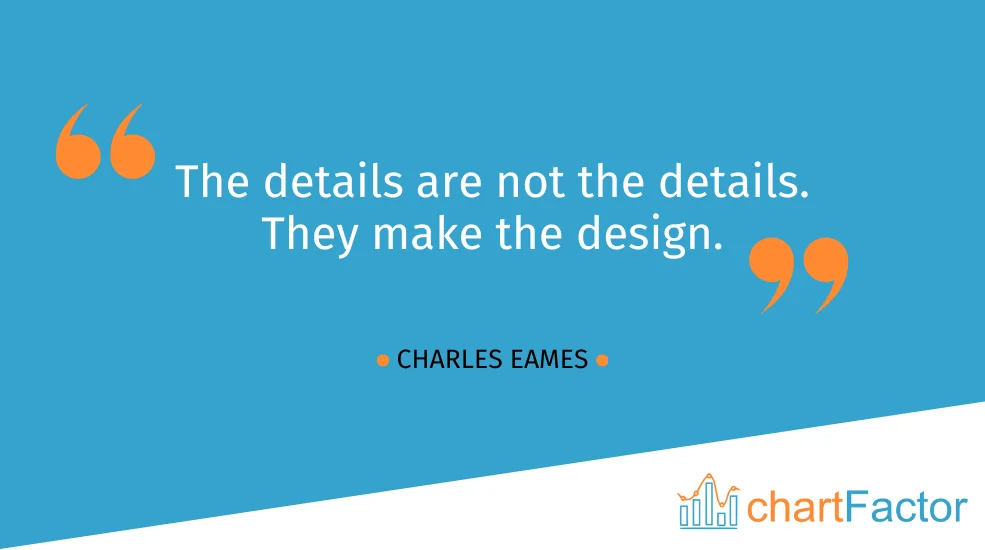
Embedded Analytics Without the Bloat

“The details are not the details. They make the design.” - Charles Eames In early-stage SaaS, what you choose to build - and how you build it - can define your product’s trajectory. This is especially true for visual…

Read article
News and Press

Enterprise Grade, Startup Ready

Today’s SaaS users expect more than static reports. They want interactive, intuitive, and responsive data experiences - right inside your product. ChartFactor helps you meet those expectations - fast. Its AI-powered…

Read article
News and Press

Move Fast, Stay in Control

Early-stage SaaS teams move fast - but technical debt often moves faster. However building fast doesn’t have to mean building fragile. With ChartFactor, you don’t just get powerful, embedded visual analytics. You get a…

Read article
News and Press

Strong Foundations, Smart Scaling

For SaaS startups, every build decision has long-term impact. You need a solution for visual analytics that’s fast to implement, scalable when the time comes, and flexible enough to grow with your unique product vision.…

Read article
News and Press

Built to Scale, Ready to Start

Visual analytics are no longer a “nice to have” - they’re a key part of how users expect to engage with data in SaaS products. But building an in-house solution can slow you down and eat up resources. ChartFactor offers…

Read article
News and Press

Seamless Growth

For SaaS startups, early adoption is critical - but long-term success depends on how well your platform adapts to scale. ChartFactor helps you build with the future in mind. Whether you’re onboarding your first 100 users…

Read article
News and Press

Move Fast, Build Right

Startups often face a tough trade-off: move fast or build right. At Aktiun, we don’t think you should have to choose. Our ChartFactor software gives SaaS founders and product teams all the tools they need to build…

Read article
News and Press

Invent the Future of Analytics with ChartFactor

"The best way to predict the future is to invent it." - Alan Kay In the SaaS world, innovation isn’t just about launching fast - it’s about building foundations that can create lasting impact. When it comes to visual…

Read article
News and Press

Build Today, Scale Forever

Every resource counts when you’re launching and growing a SaaS product - and that includes your budget. Luckily, ChartFactor offers a uniquely startup-friendly model: powerful, enterprise-grade visual analytics,…

Read article
News and Press

Evolving Together

Early growth is vital for SaaS companies - but real success means building for the long term. ChartFactor was designed with scalability at its core, providing startups with a visual analytics solution that grows…

Read article
News and Press

Move Faster, Move Smarter

In today’s fast-moving SaaS landscape, the ability to integrate powerful visual analytics quickly can make a real difference in helping your product stand out and deliver greater value to users. ChartFactor offers a…

Read article
News and Press

Charting the Next Decade of Data Exploration

"We always overestimate the change that will occur in the next two years and underestimate the change that will occur in the next ten." - Bill Gates The future of visual analytics is one of seamless exploration and…

Read article
News and Press

Shift your data perspective

Understanding your data means looking at it from every relevant angle, including geographical. ChartFactor’s advanced Geo Visualization capabilities allow you to explore your location-based data with powerful tools…

Read article
News and Press

Big Data, No Limits

Working with Google BigQuery? Your data holds valuable insights, but unlocking them shouldn’t be an uphill battle. ChartFactor Studio eliminates complexity, allowing you to seamlessly transform large datasets into…

Read article
News and Press

AI-Powered Insights

Visualizing data is just the beginning. What if your analytics platform could actively help you work smarter? ChartFactor Studio’s AI assistants transform the way users build visualizations by providing real-time…

Read article

News and Press

Smartly Simple

"Simplicity is the ultimate sophistication." - Leonardo da Vinci At Aktiun, we believe that sophisticated data insights don’t have to be complex or difficult to access. That’s why we designed ChartFactor to make visual…

Read article
News and Press

Connect. Visualize. Empower.

We are excited to share that ChartFactor Studio is now a verified Google Cloud OAuth app. This means Google BigQuery users can connect to their data and start building powerful, interactive visualizations quickly and…

Read article
News and Press

Deliver Value, Faster

Tired of wrestling with rigid BI tools, complex APIs, or proprietary data structures just to create meaningful visual analytics? Don’t worry, there is a better way! With ChartFactor, you get full control, flexibility,…

Read article
News and Press

Faster Access, Smater Insights

Exciting news! ChartFactor Studio is now a verified Google Cloud OAuth app, making it easier than ever for Google BigQuery users to visualize their data securely. With this integration, you can leverage Google Cloud’s…

Read article
News and Press

Powerful Prototyping

In today’s fast-paced world, the ability to quickly prototype and iterate is essential. ChartFactor empowers developers to rapidly build and deploy visual analytics applications with unprecedented speed and flexibility.…

Read article
News and Press

Interactive Geo Discovery

Geo map visualizations just got a whole lot smarter with ChartFactor! Our platform’s powerful Geo Map visualization is designed for those who need more than just basic mapping - it's a dynamic, multi-layer visualization…

Read article
News and Press

Fast, powerful, precise

Unlock the true potential of your data with ChartFactor’s comprehensive suite of visualization tools! Our platform offers a large selection of standard visualizations including bars, trend lines, heatmaps, radar charts,…

Read article
News and Press

Highly-embeddable design

“Sharing is good and with digital technology, sharing is easy.” Richard Stallman One of the most exciting benefits of our ChartFactor software is the ability it provides for people to share more widely, deeply and easily…

Read article
News and Press

Deliver Value Faster

Frustrated with trying to navigate your existing visual analytics solution? Perhaps it requires you to navigate complex APIs or to depend on complex, proprietary data structures in order to build your visual analytics…

Read article
News and Press

Embedded Analytics with a Native Feel

In today's enterprise software landscape, organizations face a crucial decision when integrating analytics into their applications - which general approach to take. Traditional BI solutions often demand proprietary data…

Read article
News and Press

Build and deploy with confidence

Why compromise on analytics capabilities when your data product already does the heavy lifting? ChartFactor empowers you to build rich, interactive visual analytics directly on top of your existing data infrastructure -…

Read article
News and Press

Change and opportunity

“Innovation is the ability to see change as an opportunity – not a threat.” - Steve Jobs At Aktiun we embrace change, both in our philosophy and in the way we continue to develop our ChartFactor software. Always staying…

Read article
News and Press

Highly Embeddable Analytics

One of the things that sets ChartFactor apart as a visual analytics solution is its code-transparent and highly embeddable design. We want users to take the visualizations they create and use them seamlessly - whether…

Read article
News and Press

Seamless Data Connection

When working with data, having access to diverse sources is crucial for uncovering deeper insights and making informed decisions. At Aktiun, we aim to make connecting with your data as seamless as possible. That’s why…

Read article
News and Press

Equipping you to Explore

The world of data is constantly changing. That’s why, at @Aktiun, we’re always building on and improving ChartFactor, our core visual analytics software package, helping to keep you ahead of the game. Our latest update…

Read article

News and Press

ChartFactor and Human creativity

As data and science become more accessible and more the production of software and AI, human creativity is becoming a more valuable commodity. - Hendrith Vanlon Smith JR In a world where AI and automation are everywhere,…

Read article
News and Press

Build Without Boundaries

In today's data-driven landscape, there are many visual analytics tools to choose from. But we believe that our ChartFactor Studio software really stands out from the crowd, offering a unique blend of power, flexibility,…

Read article
News and Press

Revolutionary Visualization

In today's data-driven landscape, there are many visual analytics tools to choose from. But we believe that our ChartFactor Studio software really stands out from the crowd, offering a unique blend of power, flexibility,…

Read article
News and Press

Uninterrupted Flow

Here at Aktiun, we believe that a great data visualization experience should feel fun and almost effortless. That's why we've designed our ChartFactor software to help you maintain your flow at all times. Need to test a…

Read article
News and Press

Data within the framework of a vision

“Data only exists within the framework of a vision you're building to, a hypothesis of where you're moving to.” - Reid Hoffman Sometimes data can be overwhelming. Even with powerful visualization software it can be hard…

Read article
News and Press

Making The Complex Simple

At ChartFactor Studio, we're not just improving visual analytics - we're reimagining it. Our new AI assistants are set to transform how you interact with data, making complex analysis as simple as having an everyday…

Read article
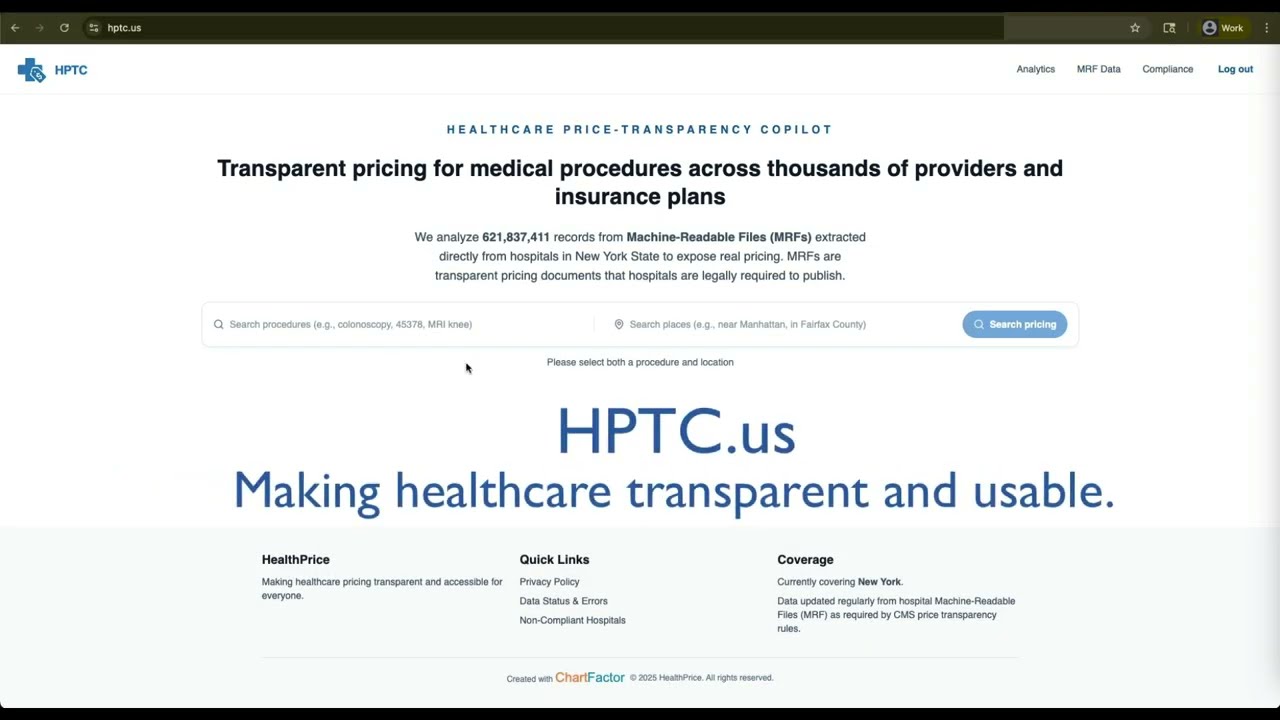
News and Press

Dreaming Big

At Aktiun we believe in dreaming big. Whether it's crafting advanced big data applications, implementing real-time streaming analytics, or designing web-based geospatial systems that help individuals and organizations…

Read article
News and Press

Giving Users Full Control

At Aktiun we believe in giving users the fullest control possible over their data-exploration experience. Many other AI assistants in the market only generate static visualizations. But ChartFactor Studio Assistant takes…

Read article
News and Press

Bridging the gap between numbers and words

“Data visualization helps to bridge the gap between numbers and words” - Brie E. Anderson With the rise of AI the gap between human language and intricate data manipulation is narrower than ever before - providing the…

Read article
News and Press

Adaptability Baked-In

In the world of visual analytics, keeping ahead of the latest developments in technology is key. It's no longer enough to build your application with whatever technology is currently in vogue, you need to have…

Read article
News and Press

AI-Enhanced Visualisation

When you are engrossed in exploring your data, the last thing you need is to have to keep switching between windows or tabs in order to try out new ideas. That’s why our new AI Assistant has been designed to allow users…

Read article
News and Press

Designed Different

Traditional BI and visual analytics solutions often come with significant complexity and cost, making them cumbersome to implement and challenging to scale. They can require extensive infrastructure, ongoing maintenance…

Read article
News and Press

Precision Data Tools

When AI meets fast, intuitive and highly scalable visual analytics, the possibilities it opens up are truly endless! By making use of AI as a precision tool in order to help users ask the right questions and to help make…
Read article
News and Press

Our Code, Your Applications

Nowadays, users expect their visual analytics solutions to provide an attractive, user-friendly experience and of course our software has been designed to excel in this regard. But what really sets ChartFactor Studio…

Read article
News and Press

The ChartFactor Studio Assistant

Our ChartFactor Studio Assistant is here! Leveraging the power of AI to guide you on your data visualization journey, ChartFactor Studio Assistant allows users to quickly obtain an insightful overview of their data;…

Read article
News and Press

Fluid Data Exploration

At the heart of ChartFactor Studio - our interactive, intuitive and highly scalable data visualization solution - is Chartfactor Toolkit. ChartFactor Toolkit is a powerful collection of components which have been…

Read article
News and Press

Intelligently Integrating AI

There has been much talk over recent months and even years of the amazing capabilities AI can offer to those organizations who embrace it. But, at @Aktiun, we understand the importance of intelligently and carefully…

Read article
News and Press

Visualizing Uncertainty and Complexity

“How we visualize data will evolve into more complex forms that better communicate uncertainty and complexity.” - Amanda Makulec Visual analytics shouldn’t offer simple solutions - unless they are the right ones. Instead…

Read article
News and Press

Helping You to Scale

When we say that ChartFactor Studio is highly scalable, it isn't just an empty phrase. Here are three ways that ChartFactor Studio has been designed with scalability top-of-mind ensuring it can accommodate all of its…

Read article
News and Press

Transparent Scalable Analytics

ChartFactor Studio is the fast, lightweight visual analytics solution you’ve been waiting for! Designed to facilitate the rapid and intuitive exploration of vast data sets, our software is available in both a desktop and…

Read article
News and Press

Question and Explore

Examining Residential Real Estate Inventory by State and County Looking into US Airline Customer Experience Comparing Medicare Inpatient Hospitals by Both Service and Provider …these are just a few of the applications we…

Read article
News and Press

Putting You in the Driver's Seat

Discover ChartFactor Studio Today! Are you looking for a fast, intuitive and scalable visual analytics solution that is easy to use right out of the box whilst also boasting a wide range of powerful features and…

Read article
News and Press

Scale to Your Requirements

We live in an increasingly interconnected world where more and more business organizations have teams spread out across the globe and have access to a wealth of disparate data that all needs to be analyzed and explored.…

Read article
News and Press

Transparent and Powerful

ChartFactor Studio, available online and as a free desktop download, offers both fast intuitive visualization and deep data interaction. But what truly sets it apart from the competition is its complete…

Read article
News and Press

Taking You on a Data Journey

Did you know that ChartFactor Studio is available in a desktop version and it’s FREE to download? Our latest desktop version offers the same scalability and flexibility as the web application, but with even more…

Read article
News and Press

Blending Technology into Everyday Life

“The advance of technology is based on making it fit in so that you don't really even notice it, so it's part of everyday life.” - Bill Gates From day one, here at @Aktiun, our philosophy has been that the technology we…

Read article
News and Press

Tools Which Empower

At @Aktiun, we understand that effective data visualization is more than just creating charts; it's about offering an intuitive, smooth, and powerful experience. That's why ChartFactor is designed with your needs in…

Read article
News and Press

ChartFactor's Airbnb App for Investors

Would you like to zoom into any city to explore detailed Airbnb statistics down to the neighborhood or specific city blocks? This ChartFactor application helps you easily visualize Airbnb listings, data made available by…

Read article
News and Press

A Data-Driven Partnership

ChartFactor is now a Databricks technology partner We are thrilled to share that ChartFactor has officially become a validated technology partner of Databricks! This partnership marks a significant milestone in our…

Read article
News and Press

Flexible cloud deployment

Nowadays, agility and flexibility in data management and application deployment are paramount. @Aktiun has designed our ChartFactor software to flourish in these conditions, enabling the instant generation and deployment…

Read article
News and Press

Boundless exploration

In the quest for the ideal visual analytics tool, the balance between flexibility, scalability, and efficiency is often hard to strike. Our ChartFactor software stands out by achieving this balance, offering a solution…

Read article
News and Press

Good communication

"Good communication doesn't just happen; it is the result of good design" - Stephen Few Great data visualization is all about communication - whether that’s revealing new problems that need to be solved or providing…

Read article
News and Press

Flexible intuitive code

At @Aktiun we believe in code transparency. Code should facilitate creation and innovation, not hold it back. That’s why we have designed our ChartFactor software to be as helpful and intuitive as possible when it comes…

Read article
News and Press

Innovation without limits

The world of technology is increasingly moving to the cloud. This enables individuals across the world to create and share digital products without having to worry about storage space or the physical location of servers…

Read article
News and Press

ChartFactor Spring Release 5.0 is Here!

We're thrilled to announce the launch of ChartFactor Studio 5.0 Spring Release with a bouquet of new features and enhancements that will help springboard your data analytics to the next level! Here's what's new: Local…

Read article
News and Press

AI-Assisted Excellence

Do you ever feel stuck when thinking about how to best visualize your data? At @Aktiun we believe in the power of technology to help people overcome problems and come up with the best solutions faster than ever before.…

Read article
News and Press

Breadth and Depth

When it comes to data visualization you want a product that delivers breadth as well as depth - luckily ChartFactor can deliver both! ChartFactor boasts a truly diverse range of standard visualizations, from bars and…

Read article
News and Press

Continuous innovation

"The enterprise that does not innovate ages and declines.” - Peter Drucker In today's dynamic business landscape, innovation is the key to staying ahead. Many companies are eager to leverage their existing data for…

Read article
News and Press

Innovative Combinations

Nowadays, many users leverage powerful open-source tools like Jupyter notebooks to help with their data exploration and sharing needs. Nonetheless many data visualization tools are not designed to work with them. Enter…

Read article
News and Press

Transparent by Default

In a world where innovation is non-negotiable, the demand for insights-driven tech that adapts to our unique needs is at an all-time high. ChartFactor Studio stands out by offering several revolutionary features that…

Read article
News and Press

Unlocking Possibilities

In our fast-paced world, staying ahead requires real-time insights. That's where @Aktiun's Chartfactor software takes the stage, revolutionizing how organizations analyze the ever-changing business landscape. Real-Time…

Read article
News and Press

Ahead of the curve

Looking back over 2023 from a tech perspective, one thing in particular stands out - the meteoric rise of AI. But this impressive leap-forward in user-friendliness didn’t occur in a vacuum. We had already seen how the…

Read article
News and Press

Medicare Inpatient Hospitals by Provider

Want to better understand information on the use, payment, and hospital charges for more than 3,000 U.S. hospitals that received IPPS (Inpatient Prospective Payment System) payments in the United States? This application…

Read article

News and Press

Making your data work for you in record time

"With data collection, 'the sooner the better' is always the best answer.” - Marissa Mayer Nowadays, most businesses and large organizations understand the importance of responsibly collecting and storing data to help…

Read article
News and Press

Widening data participation

A high-quality visual analytics solution is a key part of any modern business. It enables organizations to explore their existing data in real-time, asking a range of different questions and highlighting their data…

Read article
News and Press

Working with AI

As the adoption of AI tools for data exploration grows, many users are harnessing the power of ChatGPT and other innovative technologies to help unlock insights from their existing datasets. At @Aktiun, we're taking data…

Read article
News and Press

Turning Data into Insight

“The goal is to turn data into information, and information into insight.” -Carly Fiorina Nowadays, everyone understands the importance of data in helping us to gain information about the many problems we face and…

Read article
News and Press

Designed to Grow

When it comes to visual analytics, most users want something that is both lightweight and flexible as well as highly scalable. This can often be a hard balance to achieve - with many existing solutions being either…

Read article

News and Press

Technology Neutral

As the world around us continues to grow ever more interconnected, we see the technology people use also start to become more and more interchangeable and interoperable. This is particularly true when it comes to the…

Read article

News and Press

The right visual analytics for the job

When it comes to data, we all want it to tell a story. Of course, this story will change and evolve as you gain access to more data and as your understanding grows through exploration, creating a multi-faceted picture…

Read article
News and Press

Intelligent decision making

“Intelligent decision making entails knowing what tool to use for what problem” - Gerd Gigerenzer Effective Visual data analytics isn’t just about representing data in an attractive and intuitive way. It’s about having a…

Read article
News and Press

High-Velocity Implementation

Product Owners and Managers often have a clear vision of the kind of visual analytics application they would like to create. Of course this vision can change over time as requirements and understanding changes. But, if…

Read article
News and Press

Putting innovation first

Elevate your Data Products with ChartFactor's rapidly-deployable Visual Analytics Solutions! In today's fast-paced business landscape, time-to-market is of the essence. Introducing ChartFactor – your ticket to…

Read article

News and Press

ChartFactor Fall 2023 Release

The Fall 2023 release of the ChartFactor Visual Analytics Platform is now out. Packed full of customer-driven improvements and providing amazing value for our community users, it is available right now at…

Read article
News and Press

Insights, collaboration and exploration

“Information is the oil of the 21st century, and analytics is the combustion engine.” - Peter Sondergaard Analytics helps turn raw data into a series of meaningful relationships. But visual analytics arguably takes this…

Read article
News and Press

Expand Your Vision

Looking for a data visualization solution that ticks all the boxes? Our ChartFactor data visualization software comes with an incredible range of built-in tools and capabilities. But it has also been designed to be…

Read article
News and Press

The Cutting-Edge of Data Visualization

Do you want a high-quality, easily embeddable data visualization solution as soon as possible? For Product Owners and Managers who need to generate high-quality, intuitive and powerful data visualizations, speed and…

Read article
News and Press

Scalable, Intuitive, Extendable

When it comes to visual analytics you want a solution that embodies the most effective and up-to-date features. Luckily our ChartFactor visual analytics software has got you covered! Our technology agnostic approach…

Read article
News and Press

Share your insights

What good are your insights if you can’t share them with others? ChartFactor allows you to easily create in-depth, exciting data explorations which can be shared and interacted with by users across a wide range of…

Read article
News and Press

NCHS Drug Poisoning Mortality by County

Check out this ChartFactor application, which allows users to visualize the National Center for Health Statistics (NCHS) drug poisoning mortality rates by county. Using a time slider we can replay and explore the data…

Read article
News and Press

Technology Agnostic

In the ever-expanding digital economy, web development has witnessed an influx of new technologies and approaches. Countless languages and frameworks now power sophisticated online applications of an almost infinite…

Read article
News and Press

Stay Ahead of the Competition

Do you need visual analytics for your product in record time? At @Aktiun we understand that the rapid pace of societal and technological change means getting their visual analytics solution up and running as quickly as…

Read article
News and Press

Intuitive Visual Exploration

Transform Your Data into Visual Insights! ChartFactor transforms your data into visual masterpieces, enabling you to see patterns, connections, and opportunities that were once hidden: allowing Product Owners and…

Read article
News and Press

Reach New Heights

When it comes to data applications, scalability is key. Luckily, our software’s edge computing design empowers your visual analytics applications to scale seamlessly, accommodating tens of thousands of users and…

Read article
News and Press

Realize Your Vision

Want a visual analytics solution that really delivers on its promises? At @Aktiun we make sure to work closely with all new clients who use our ChartFactor visual analytics software in order to develop a rapid initial…

Read article
News and Press

ChartFactor - Cell antennas in the US

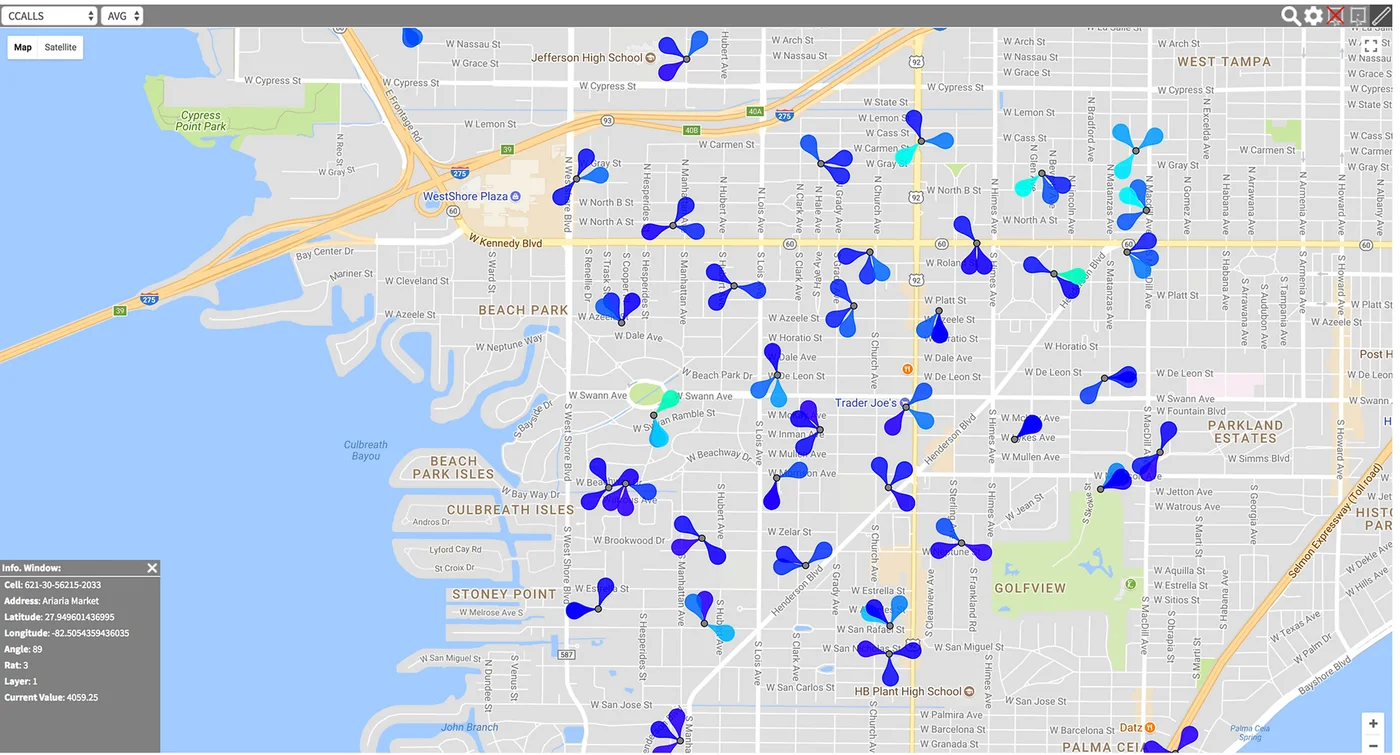
Interested in how ChartFactor’s fully customizable and embeddable Geo Map can render 3D content while working with other visualizations to present large amounts of data? Check out this ChartFactor application! It allows…

Read article
News and Press

Rapid Deployment

Accelerate Time-to-Market for Your Data Products with ChartFactor. Are you tired of spending excessive time and resources integrating BI products or developing in-house functionalities for your visual analytics…

Read article
News and Press

Finding the Solution Together

For Product Owners and Managers, finding the right visual analytics solution to explore, represent and share their data is a major priority. But, if they want to get the most from their data, they need to make sure that…

Read article
News and Press

ChartFactor - Effective visual analytics

"Visualization gives you answers to questions you didn't know you had." - Ben Shneiderman To truly grasp the dynamics of your industry and overcome challenges, it's crucial to visualize your data in meaningful and…

Read article
News and Press

Enabling Real-Time Decision Making

Have you heard of Edge Computing? In more traditional setups, data is often moved and processed in highly centralized systems. However, edge computing brings the processing power much closer to the source of data,…

Read article
News and Press

Smooth Integrations

Say Goodbye to Costly Integrations! One of the ways our ChartFactor software is helping to revolutionise the visual analytics landscape, is by removing the complexity and expense associated with integrating traditional…

Read article
News and Press

Design the Tool you need

Do you know where your data is going to take you? Product Managers and Owners often have a good initial idea of how users might exploit their data product but their requirements and interests can rapidly change, even as…

Read article
News and Press

Communication Matters

Every Data Product deserves a visual analytics solution that fits its unique requirements. But understanding these requirements necessitates effective communication. That’s why our Rapid Prototyping Process is so focused…

Read article
News and Press

Fast, Intuitive, Powerful

Is your Data Visualisation solution as Fast, Intuitive and Powerful as it could be? At @Aktiun we believe that an ideal visual analytics solution should be a versatile and intuitive tool that is capable of solving…

Read article
News and Press

ChartFactor embedded analytics

“You can focus on things that are barriers or you can focus on scaling the wall or redefining the problem.” - Tim Cook We believe that Product Managers and Owners need the flexibility to change their approach as…

Read article
News and Press

Scalable Solutions

A quality visual analytics application needs to be flexible enough to meet a range of complex challenges from Day 1. For this reason, ChartFactor has been designed to be both highly scalable and highly embeddable. The…

Read article
News and Press

NY City 311 Calls

Interested in how ChartFactor’s fully customizable and embeddable Geo Map can work with other visualizations to help render massive amounts of data on different layers? Check out the following example, where we use a…

Read article
News and Press

Custom Charts without Constraints

Are your data tools holding your users back? Not every requirement can be predicted ahead of time. That’s why ChartFactor provides users with the possibility to create completely custom charts with no constraints:…

Read article
News and Press

Rapid Prototyping

What makes Rapid Prototyping so powerful? We use this process to quickly create a sample application that our customers can interact with to demonstrate proof of concept. Once we have proven value via the Prototype, we…

Read article
News and Press

Core Advantage of Data

“The core advantage of data is that it tells you something about the world you didn’t know before” - Hilary Mason If you want insights, you need data. To properly exploit and explore this data you need a sophisticated…

Read article
News and Press

Data Evolution Over Time

When product managers are looking to exploit their product's data, they need to be able to dynamically explore it from a number of different angles. Often, one of the most fruitful approaches is to look at the various…

Read article
News and Press

Continuous Improvement

Our March 2023 release of the ChartFactor Visual Analytics Platform saw a wealth of new features added to the software - and many existing ones tweaked and improved as well. From sophisticated geospatial data…

Read article
News and Press

ChartFactor March 2023 Release

The ChartFactor team is proud to present the March 2023 release of the ChartFactor Visual Analytics Platform, the most powerful solution for embedded visual analytics. Brand new in this release: 1. Geo Map GL - This…

Read article
News and Press

Technology Agnostic

With the continued growth of the digital economy, recent years have seen the rise of countless new technologies and approaches when it comes to web development. Nowadays, sophisticated online applications could be…

Read article
News and Press

Magnifying your data

Being able to explore data and share it with others isn’t just about what you can focus on but what you can hide as well! ChartFactor’s highly customisable dashboard allows users to show or hide whichever parameters they…

Read article
News and Press

Making data meaningful

“Data are just summaries of thousands of stories - tell a few of those stories to make the data meaningful!” - Dan Heath Data tells a story, but you need the right tools to make sure it is a coherent and meaningful one!…

Read article
News and Press

Elegant, exportable data solutions

When you have hit upon an elegant and exciting data-oriented solution to a particular problem, one of the first things you are going to want to do is to share it with others. Unfortunately this is often far from easy to…

Read article
News and Press

Your Data, our Visual Magic

Most Product Managers and Owners want a powerful, flexible and intuitive visual analytics solution which they can have built on top of their existing data product and they want it to be easy to use and maintain as well.…

Read article
News and Press

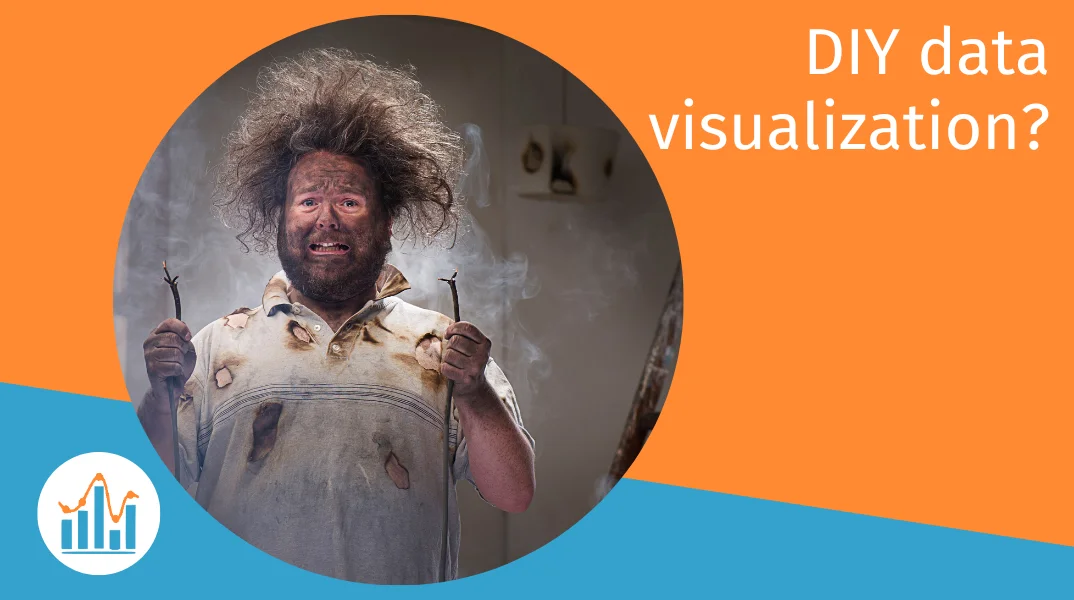
DIY data visualization?

After looking at the potential costs and downsides of using an existing Business Intelligence (BI) solution, you might be tempted to have a go at designing one for yourself. But too many times Product Managers attempt to…

Read article
News and Press

Ideas and effective communication

“A good idea is an orphan without effective communication” - Andrew Hunt Your product might have access to the most groundbreaking and powerful data, but if you can’t effectively share it with others then it doesn’t mean…

Read article
News and Press

To Build or Not to Build?

When it comes to selecting a Business Intelligence (BI) solution for your data product’s needs, ‘Buy or Build?’ is often the first question that product managers and owners end up asking themselves. But whichever of…

Read article
News and Press

A fresh take on data visualization

Do you find yourself frustrated that you can’t easily present your product’s data to your users in a way that is attractive, persuasive and powerful? Your product has access to excellent data and your data science team…

Read article
News and Press

ChartFactor January 2023 Release

The January 2023 release of the ChartFactor Visual Analytics Platform is now available, bringing more customer-driven features and improvements that accelerate the creation of powerful interactive data applications -…

Read article
News and Press

Extensible, scalable, lightweight

No matter what business you're in, data is a critical part of understanding what's happening and making decisions. But turning data into insights is not always easy - that's where data visualization and exploration tools…

Read article
News and Press

Making the complex simple

Have you ever struggled to make decisions even when you have access to large quantities of data? In fact, at a certain point, the volume of data can quickly become overwhelming. This is where ChartFactor comes in.…

Read article
News and Press

Data enhancing intuition

“Data is a tool for enhancing intuition” - Hilary Mason. You bring the questions based on your knowledge of your field and your feel for the right queries to make; the data delivers the insight. And beautifully presented…

Read article
News and Press

Make your data stand out

Data professionals know that data can be hard to understand and not very engaging unless properly presented. Effective presentation highlights different categories and helps identify trends and groups that otherwise…

Read article
News and Press

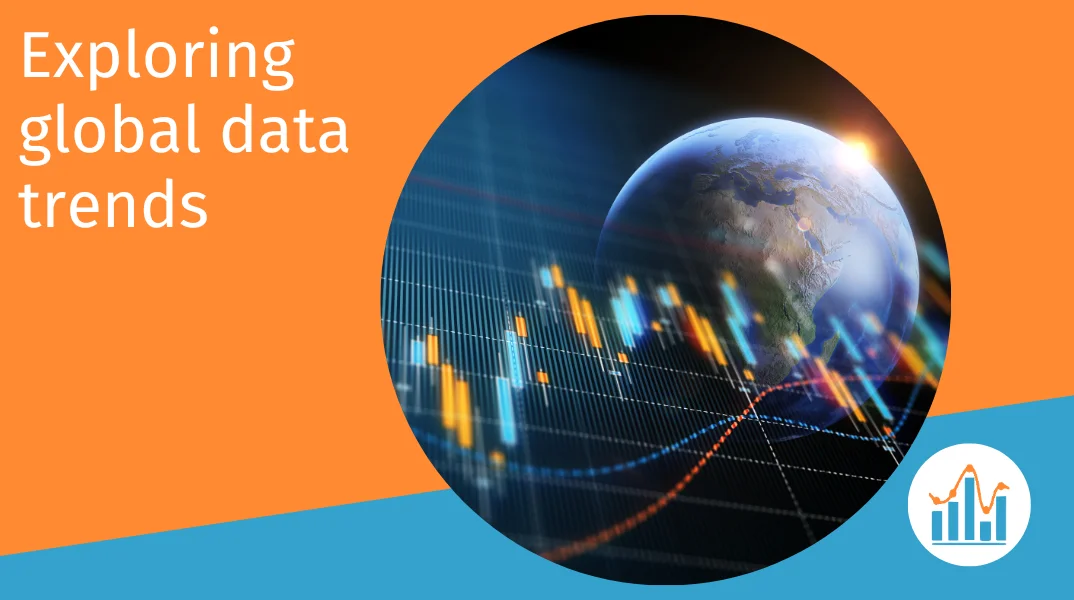
Exploring global data trends

In our highly complex and interconnected world, the events that confront us can sometimes feel totally overwhelming. How can individuals be expected to have a good understanding of complex phenomena that sometimes span…

Read article
News and Press

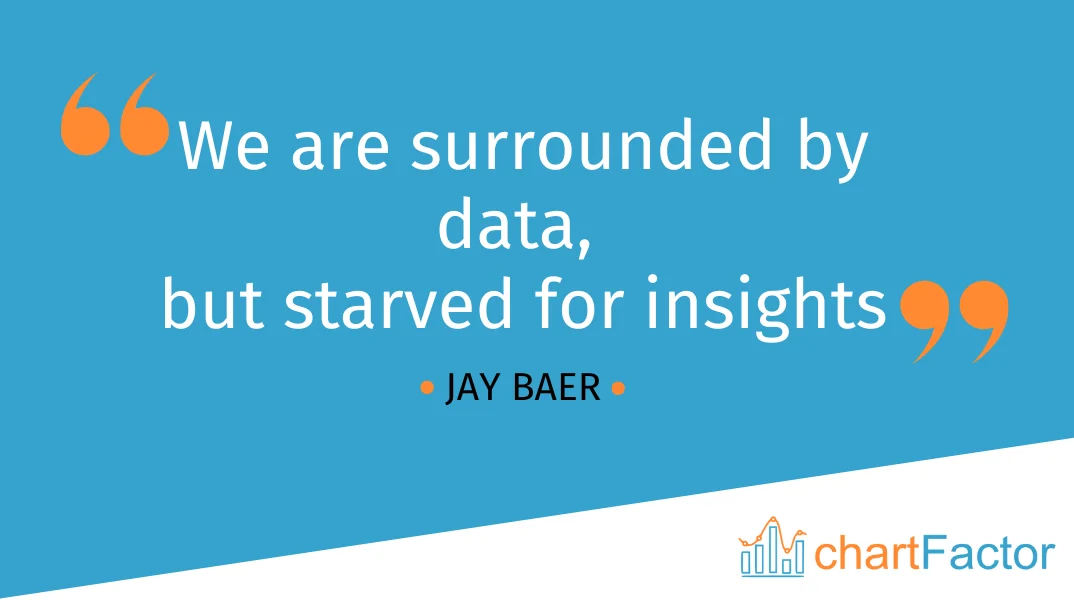
Data insights

“We are surrounded by data, but starved for insights” - Jay Baer Our ChartFactor software can help to turn your raw data into actionable insights by allowing you to dig deep using our highly interactive and intuitive…

Read article
News and Press

Dynamic Data

When we are exploring complex and multi-faceted data, there is no one-size-fits all solution. Every use-case is different and - crucially - may change over time, sometimes in significant and unexpected ways! That’s why…

Read article
News and Press

Where will the data lead you?

Nowadays, most people understand the importance of data in helping us to understand the world around us. But one of the biggest challenges faced by those working in this field is how to make raw figures and statistics…

Read article
News and Press

ChartFactor - Analysing data across time

One of the issues we encounter, when exploring data, is knowing which timeframe is going to be most appropriate for our needs. Making use of data sets from previous time periods may provide useful insights, or it may…

Read article
News and Press

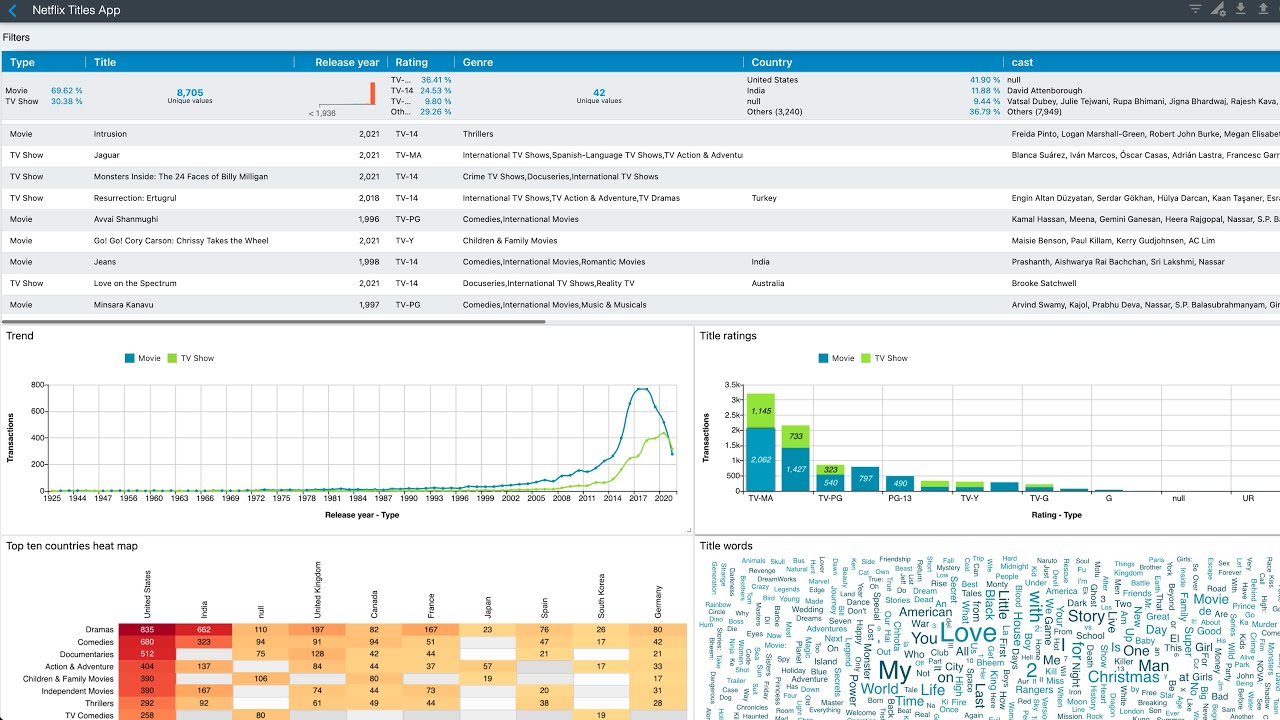
Visualizing the Netflix Titles dataset

In this video, we use ChartFactor and the Netflix Movies and TV Shows dataset provided by Shivam Bansal in Kaggle to create an interactive data application with multiple search-enabled visualizations. You can also…

Read article
News and Press

ChartFactor - Let us build it for you

There is no doubt that many are feeling the squeeze. In many large and medium-sized organisations, budgets need to be far more efficiently allocated in order to deal with decreased overall funding and rising inflationary…

Read article
News and Press

ChartFactor - Presentation matters

When it comes to data, presentation matters. Effective presentation allows people to truly engage with data and helps to capture their interest from the get-go. This extends to UI - an interactive, intuitive interface…

Read article
News and Press

ChartFactor September 2022 Release

We are proud to present the September 2022 release of the ChartFactor Visual Analytics platform, the most powerful solution for embedded visual analytics. Continuing with our simplicity and effortlessness theme, you can…

Read article
News and Press

ChartFactor Py - Colors and Interactivity

This video shows how to create a beautiful interactive data application using a Data Breaches 2004-2017 dataset found in Kaggle. The application includes a drop-down to select different methods of leak and it also shows…

Read article
News and Press

ChartFactor June 2022 Release

The June 2022 release of the ChartFactor Visual Analytics Platform is now available, focusing on simplicity and effortlessness for ChartFactor Studio and ChartFactor Py as well as powerful new features for embedded…

Read article
News and Press

ChartFactor Py on Kaggle

This video shows you how to explore your Pandas DataFrames in Kaggle using ChartFactor Py. We read the Healthy Lifestyle Cities 2021 Report data, we interact with the data to find insights and then we visualize cities…

Read article
News and Press

ChartFactor November 2021 Release

The November 2021 release of the ChartFactor Visual Analytics Platform is now available, providing more beauty and power to our customers and the visual analytics community. With ChartFactor Studio you can now use an…

Read article
News and Press

ChartFactor Real Estate Statistics

At ChartFactor, sample apps use real-life data! Check out the latest Real Estate trends using our Real Estate Market Statistics app. Data is courtesy of realtor.com and updated monthly as they make this data available.…

Read article
News and Press

ChartFactor September 2021 Release

The September 2021 release of the ChartFactor Visual Analytics Platform is now available, adding powerful customer-driven features while providing amazing value to our community users. With our new release, you can now…

Read article
News and Press

US Airline Customer Experience

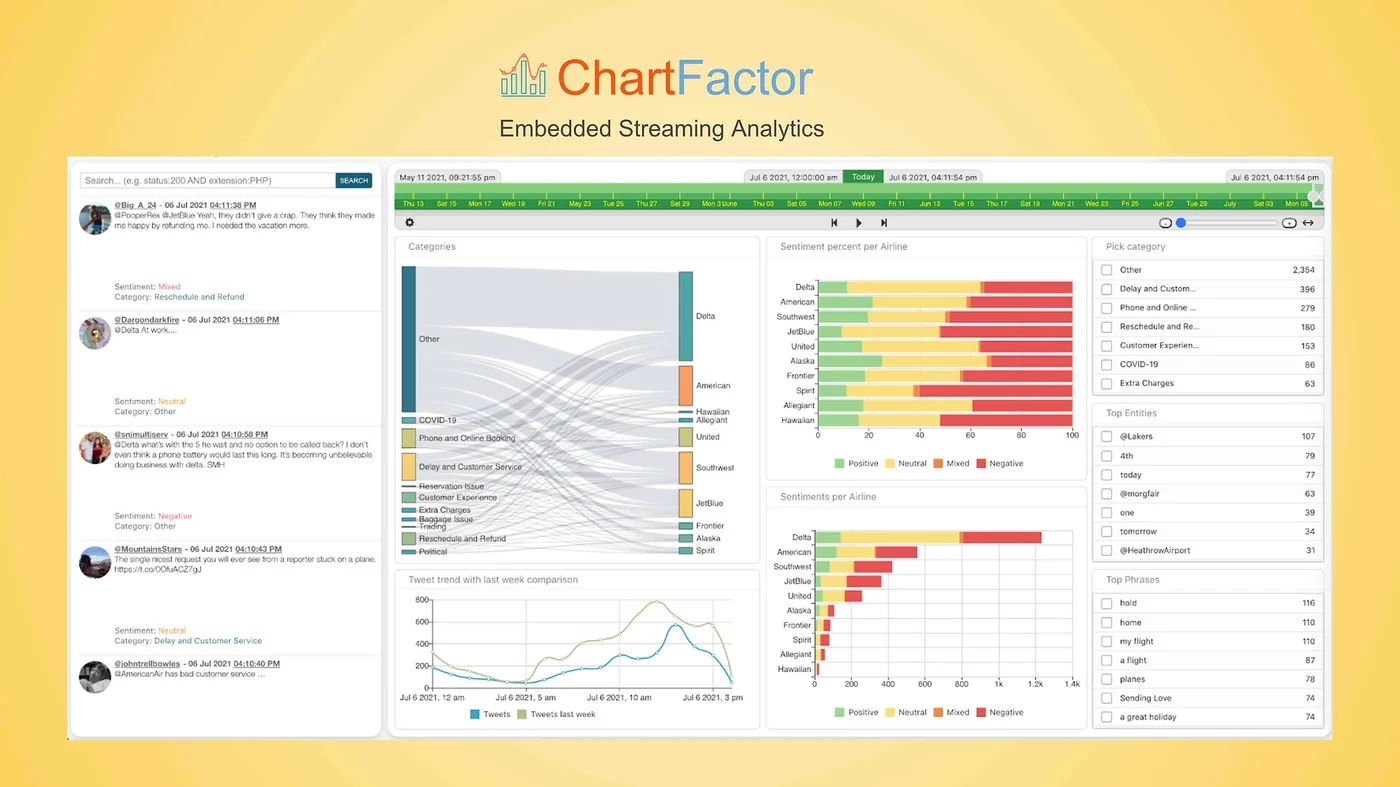
With social media becoming a channel of choice, US Airlines customer experience from tweets is streaming day and night, and you can now visualize it using our publicly available US Airlines Customer Experience app.…

Read article
News and Press

ChartFactor June 2021 Release

The June 2021 release of the ChartFactor Visual Analytics Platform is now available, packed with customer-driven improvements and amazing value for our community users, instantly available at chartfactor.com. Our new…

Read article
News and Press

ChartFactor April 2021 Release

The ChartFactor team is proud to present the April 2021 release of the ChartFactor Visual Analytics Platform, the most powerful solution for embedded visual analytics. It brings a wealth of customer-driven features and…

Read article
News and Press

ChartFactor September 2020 Release

The Aktiun team is proud to present the September 2020 release of the ChartFactor Visual Analytics Platform. It increases its lead as the fastest, most flexible and powerful solution for embedded visual analytics. This…

Read article
News and Press

Video tutorial: Embedding

Our Embedding video tutorial shows you how to embed ChartFactor Studio visualizations into your custom application with easy copy/pasting steps. This is the fourth video tutorial of the Visual Analytics Fundamentals…

Read article
News and Press

China - Air pollution 2015

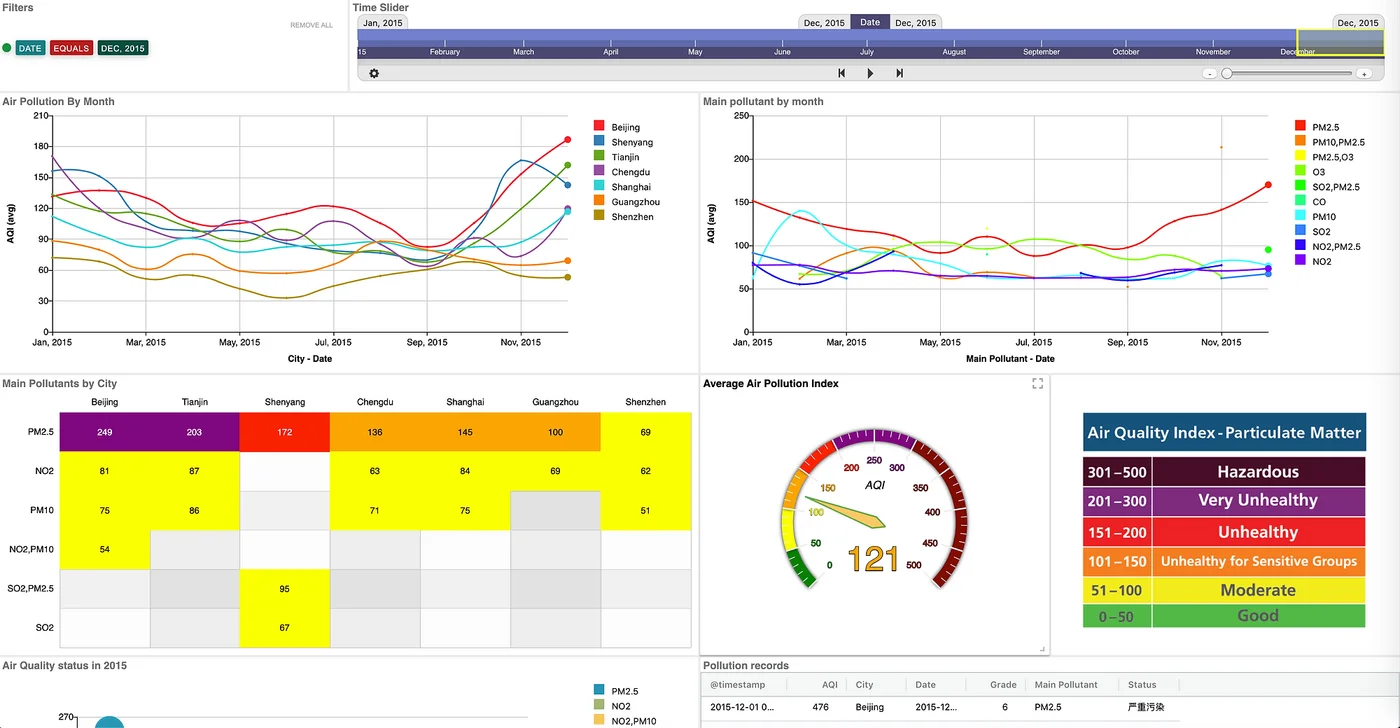
Replay data month by month and visualize main pollutants and air pollution levels across China's main cities. Select the picture to open the application. Visualizations created using ChartFactor Studio and custom app…

Read article
News and Press

Video tutorial: Adding calculations

Our third ChartFactor Studio video tutorial: Adding calculations! It walks you through adding derived metrics, custom labels, and additional configurations to the dashboard we created in our previous tutorial using…

Read article
News and Press

ChartFactor May 2020 Release

The May 2020 release of the ChartFactor Visual Analytics Platform is now available, adding powerful customer-driven features and improvements while providing amazing value to our ChartFactor community users, instantly…

Read article
News and Press

Video Tutorial: ChartFactor Studio Introduction

Our first video tutorial: ChartFactor Studio introduction! Click here to go to the class materials. Additional videos to come soon to cover fun topics such as interactivity, embedding, and more! ChartFactor

Read article
News and Press

ChartFactor April 2020 Release

The April 2020 release of ChartFactor, the lightweight visual analytics platform, is now available, bringing more value to your visual analytics projects and increasing its lead as the best visual analytics platform in…

Read article
News and Press

ChartFactor February 2020 Release

The February 2020 release of the ChartFactor Visual Analytics Platform is now available, packed with customer-driven improvements and amazing value for our community users, instantly available at chartfactor.com. With…

Read article
News and Press

ChartFactor December 2019 Release

The December 2019 release of the ChartFactor Visual Analytics Platform is now available, increasing ChartFactor's lead as the best visual analytics platform in the market while providing amazing value with its free…

Read article
News and Press

ChartFactor October 2019 Release

The October 2019 release of ChartFactor, the Lightweight Visual Analytics Platform, is now available, bringing more value to your visual analytics projects! This release adds Redshift to its growing list of data…

Read article
News and Press

ChartFactor 1.13 Released

The August 2019 release of ChartFactor is now available! This new release keeps extending ChartFactor's lead as the best solution to bring visual analytics to your data products. The ChartFactor Toolkit introduces…

Read article
News and Press

ChartFactor 1.12 Released

The June 2019 release of ChartFactor is now available! ChartFactor, the leading solution to bring visual analytics to your data products, just got better and more useful to its growing customer base. This release…

Read article
News and Press

ChartFactor 1.11 Released

The March 2019 release of ChartFactor is now available! This new release extends ChartFactor’s lead as the best solution to bring visual analytics to data products. It introduces what in our opinion is the most advanced…

Read article
News and Press

ChartFactor 1.10 Released

The January 2019 release of ChartFactor is now available This new release extends ChartFactor's lead as the best toolkit to build analytics on top of modern data. It introduces interaction rules to easily customize how…

Read article
News and Press

Presenting ChartFactor Community Access

ChartFactor is a powerful tool for data analysis that allows you to query data from different types of data engines to visualize it and interact with it in different ways depending on your needs, all this without…

Read article
News and Press

Aktiun Announces Native Analytics For Everyone

Introduces ChartFactor Studio Beta and Community Access FAIRFAX, Va., Oct. 30, 2018 /PRNewswire/ -- Aktiun (http://www.aktiun.com) today announced the beta release of ChartFactor Studio (https://chartfactor.com/studio),…

Read article
News and Press

Building search-based analytics with ChartFactor

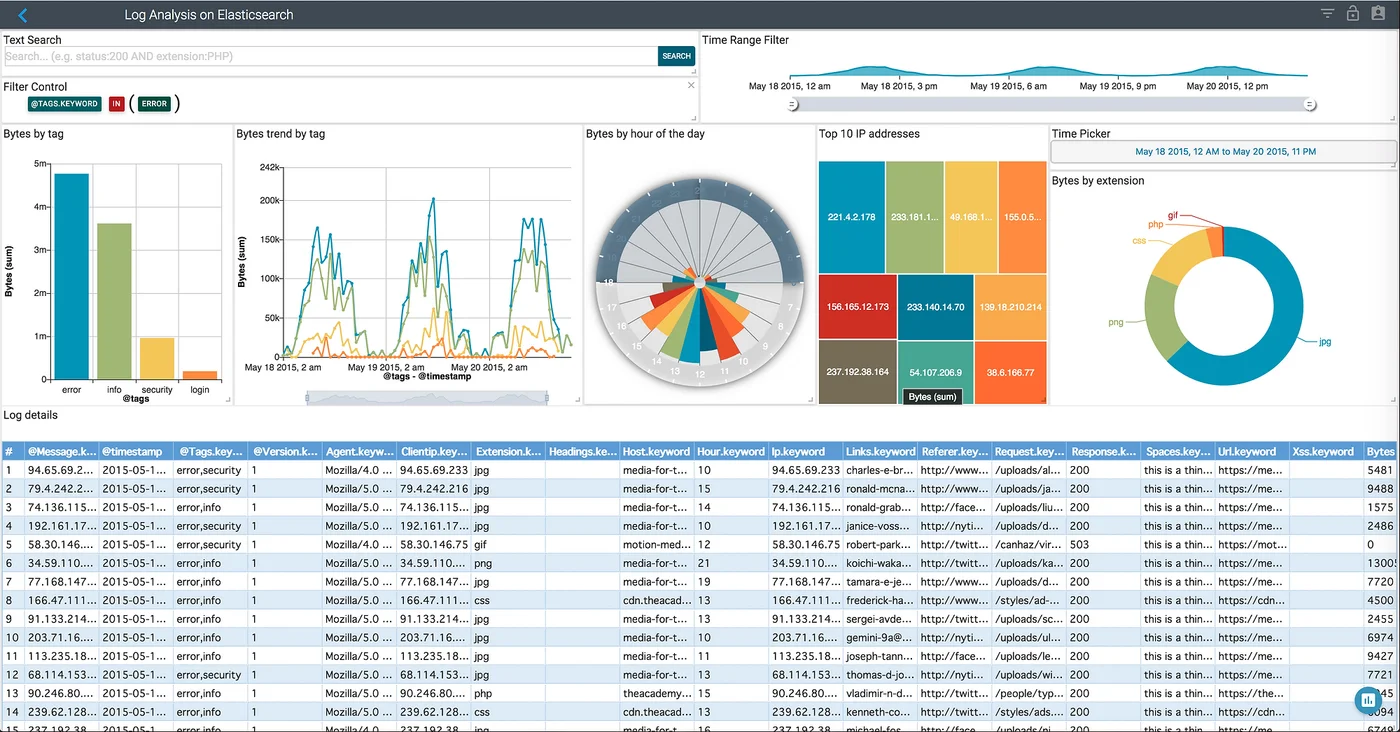
This article shows how ChartFactor components can be used to build data applications that enable users to search, explore, and visualize ElasticSearch data natively. ChartFactor is a component-based toolkit that speeds…

Read article
News and Press

Geospatial Data Visualization Challenges for Telcos

This article describes geospatial, big data and real time data visualization challenges that telecommunication companies face and provides our experience to solve these needs in a comprehensive way. The Problem Having…

Read article
News and Press

Building Advanced Dashboard Systems

At Aktiun, we prototyped a dashboard system that brings together concepts of pluggable visualizations and data providers in addition to configuration thru code. The system was built using React.js for UI components, Mobx…

Read article
News and Press

Mobile Applications with Ionic 2 and Zoomdata

At Aktiun, we tried the preview release of Ionic 2 which is based on Angular 2 together with the Zoomdata query API. This video describes two mobile applications we developed for this test. The first one is similar to…

Read article
LET'S BUILD WHAT'S NEXT

Ready to build what's next?

Tell us what you want to build, connect, modernize, or make more intelligent.

Start a conversation