Building Fast Data Applications With ChartFactor And Dremio
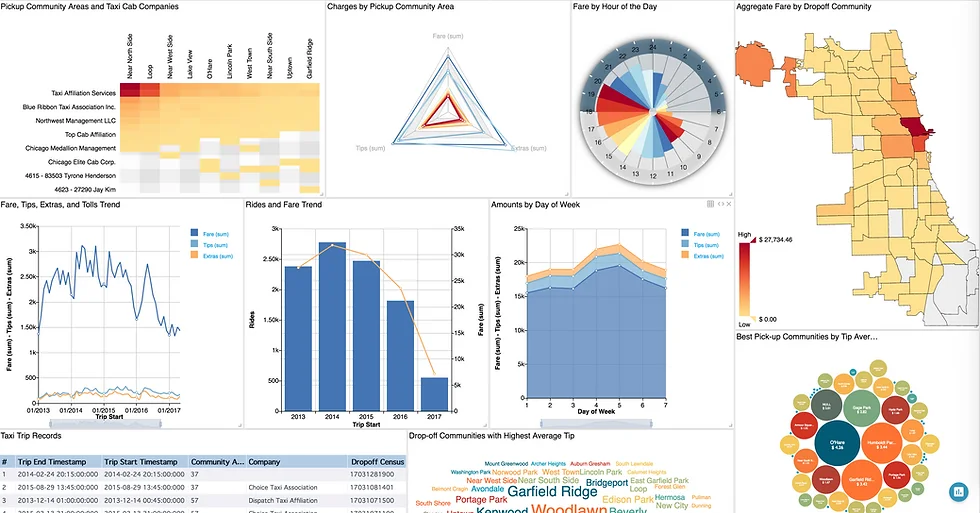
At Aktiun we wanted to try the latest version of Dremio together with ChartFactor components to visualize large amounts of data interactively.
For this test, the Aktiun team selected the full Chicago Taxi Trips dataset available from the City of Chicago’s website. This is not a few thousand rows for a day’s worth of data, or 1 million or 10 million rows but the full 112 million documents covering taxi trips starting from 2013 up to the second quarter of 2017.
We used ChartFactor Studio to quickly generate the code for each of the components we wanted to include. We initially created our data application pointing to Elasticsearch. Thanks to ChartFactor’s data provider abstraction, pointing to Dremio was a matter of declaring the Dremio provider and updating the widgets to use the Dremio provider instead. No need to re-add components.
The video below shows the end result within ChartFactor Studio:
Components worth mentioning are:
-
The pivot table breaking down rides and revenue by district and community areas and pivoting on form of payment.
-
A range filter to easily exclude trips that are either too short or too long
-
A vector map to visualize Chicago’s community areas
-
A disk to visualize activity on different hours of the day
-
KPI widgets to keep track of important metrics
On the security side, the application leverages Dremio’s authentication capabilities and security model.
ChartFactor’s simplified programming model with innovative pipe-based syntax where the output of one function flows into the next, in addition to its patent-pending architecture with optimized execution makes creating data applications simple and fast.
Now, ChartFactor Studio is just a container of ChartFactor components with code generation capabilities. ChartFactor components can run on standalone HTML pages and on your web and mobile framework of choice. It is a powerful realization of the embedded analytics concept, allowing you to provide relevant information and analytical tools to end users so that they can work more efficiently in the applications they use every day.
In summary, ChartFactor allows users to quickly create advanced data applications that are performant, scalable, secured, easy to interact with, and beautiful. It provides all the needed pieces: the components to query analytics engines, the visualizations to render, and the interactivity between them, all in well-defined components that users can configure in any way they want.
Loading article activity…
Join the conversation.
Be the first to share a thought.


