Building Advanced Dashboard Systems
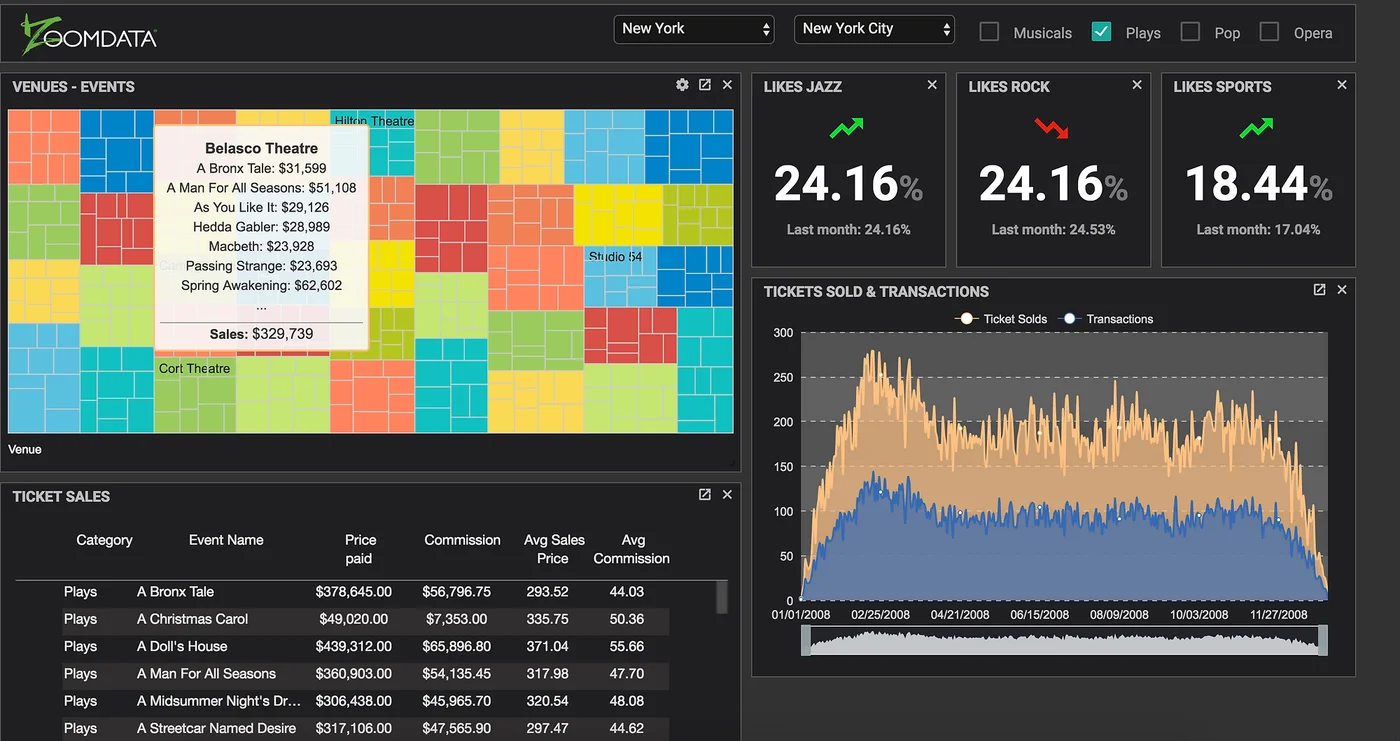
At Aktiun, we prototyped a dashboard system that brings together concepts of pluggable visualizations and data providers in addition to configuration thru code. The system was built using React.js for UI components, Mobx for state management, Echarts 3 as the charting and visualizations library in addition to the Zoomdata’s data query API as the data provider.
Configuring data providers can be done straight from dashboards. The first one we implemented is the Zoomdata data provider which supports Zoomdata versions 2.3 and 2.5. It allows users to create dashboards selecting charts from multiple Zoomdata servers. It uses the Zoomdata Data Query API to query the data.
Query and visualization parameters behind charts can be modified using its code editor right from the dashboard. The idea is that advanced users can access the code behind charts to specify fields to query, metrics to aggregate, how to sort results, and everything needed to bring the right data to their charts. The editor also allows to specify chart variables such as color and axis labels. The first video below shows how to create dashboards using these features.
Dashboard interactivity can be augmented using a Filter Control component. When added to dashboards, users can select areas of their charts they want to filter by. As users interact with the charts, the Filter Control displays filters applied to the dashboard allowing users to remove them if needed. Users can also add a Configurable Filter component to display attribute and metric values for easy filtering. The second video below shows these features in action.
In summary, Aktiun dashboards easily scale not only on the amount of data they query but also on the type of visualizations and interactions they support while allowing full configurability thru code. This prototype was developed using React.js, Mobx, ECharts 3 in addition to the Zoomdata’s data query API.
Loading article activity…
Join the conversation.
Be the first to share a thought.


